Figure 2.1
Every second semester, the School of Business at a large university coordinates with local business leaders at a luncheon for graduating students, their families, and friends. Corporate sponsorship pays for the lunches of each of the graduating students, but students have to purchase tickets to cover the cost of lunches served to guests they bring with them. The following histogram represents the attendance at the luncheon, where X is the number of guests each graduating student invited to the luncheon and f is the number of graduating students in each category. 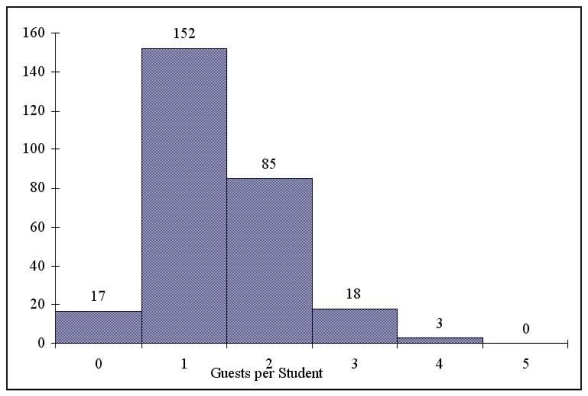
-Referring to the histogram from Figure 2.1,if all the tickets purchased were used,how many guests attended the luncheon?
A) 275
B) 4
C) 152
D) 388
Correct Answer:
Verified
Q75: Facebook collected information on the age of
Q78: Figure 2.2
The histogram below represents scores achieved
Q79: In general,a frequency distribution should have at
Q81: Figure 2.2
The histogram below represents scores achieved
Q82: Instruction 2.6
The frequency distribution below represents
Q83: In constructing a polygon,each class grouping is
Q84: The width of each class grouping or
Q85: A _is a summary table in which
Q121: A polygon can be constructed from a
Q134: The percentage polygon is formed by having
Unlock this Answer For Free Now!
View this answer and more for free by performing one of the following actions

Scan the QR code to install the App and get 2 free unlocks

Unlock quizzes for free by uploading documents