Figure 2.1
Every second semester, the School of Business at a large university coordinates with local business leaders at a luncheon for graduating students, their families, and friends. Corporate sponsorship pays for the lunches of each of the graduating students, but students have to purchase tickets to cover the cost of lunches served to guests they bring with them. The following histogram represents the attendance at the luncheon, where X is the number of guests each graduating student invited to the luncheon and f is the number of graduating students in each category. 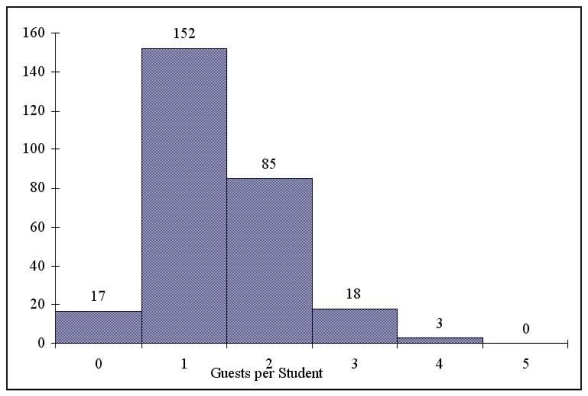
-Referring to the histogram from Figure 2.1,how many graduating students attended the luncheon?
A) 388
B) 275
C) 4
D) 152
Correct Answer:
Verified
Q30: The width of each bar in a
Q61: Data on 1,500 students' weight were collected
Q62: When constructing charts,the following is plotted at
Q64: Data on the number of part-time hours
Q66: Figure 2.2
The histogram below represents scores achieved
Q67: When polygons or histograms are constructed,which axis
Q69: When constructing polygons or histograms,the horizontal axis
Q104: An ogive is a cumulative percentage polygon.
Q105: Ogives are plotted at the midpoints of
Q134: To determine the width of class interval,
Unlock this Answer For Free Now!
View this answer and more for free by performing one of the following actions

Scan the QR code to install the App and get 2 free unlocks

Unlock quizzes for free by uploading documents