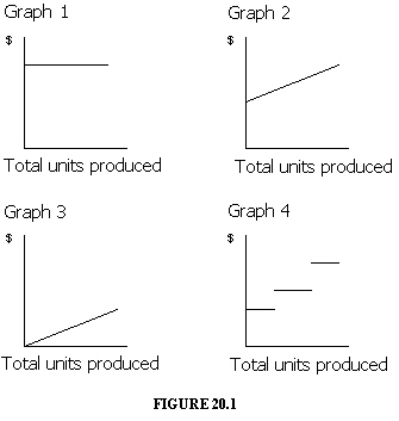
 Which of the graphs in Figure 20-1 illustrates the nature of a mixed cost?
A) Graph 2
B) Graph 3
C) Graph 4
D) Graph 1
Correct Answer:
Verified
Q62: Costs that remain constant in total dollar
Q70: Costs that vary in total in direct
Q73: Which of the following describes the behavior
Q76: Which of the following activity bases would
Q79: Which of the following is NOT an
Q80: Most operating decisions of management focus on
Q80: Which of the following describes the behavior
Q81: The manufacturing cost of Prancer Industries for
Q82: As production increases, what should happen to
Q113: If sales are $425,000, variable costs are
Unlock this Answer For Free Now!
View this answer and more for free by performing one of the following actions

Scan the QR code to install the App and get 2 free unlocks

Unlock quizzes for free by uploading documents