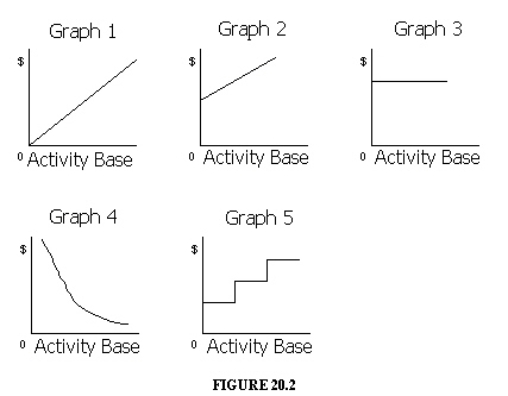
The cost graphs in the illustration below shows various types of cost behaviors.
For each of the following costs, identify the cost graph that best describes its cost behavior as the number of units produced and sold increases:

Correct Answer:
Verified
Q196: The Tom Company reports the following data.
Q198: Trail Bikes, Inc. sells three Deluxe bikes
Q199: The Dean Company has sales of $500,000,
Q201: For the past year, Pedi Company had
Q203: For the past year, Hornbostel Company had
Q205: A company has a margin of safety
Q206: Kissimmee Paint Co. reported the following data
Q211: A business had a margin of safety
Q212: Perfect Stampers makes and sells aftermarket hub
Q214: Cordell, Inc. has an operating leverage of
Unlock this Answer For Free Now!
View this answer and more for free by performing one of the following actions

Scan the QR code to install the App and get 2 free unlocks

Unlock quizzes for free by uploading documents