Figure: Supply and Demand 1 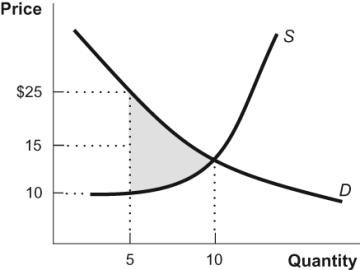 At a market quantity of 5,the shaded region in the figure represents:
A) satisfied wants.
B) unexploited gains from trade.
C) the value of wasted resources.
D) willingness to pay.
Correct Answer:
Verified
Q64: When producers produce more than the equilibrium
Q66: Figure: Basic Supply and Demand M
Q67: In a free market in which an
Q69: Gains from trade are maximized when:
A) the
Q72: When the price of a good equals
Q73: Gains from trade are maximized in a
Q77: Use the following to answer questions:
Figure: Price
Q78: The equilibrium quantity is the quantity at
Q80: Tim values treats for his dog at
Q99: Use the following to answer questions:
Figure: Price
Unlock this Answer For Free Now!
View this answer and more for free by performing one of the following actions

Scan the QR code to install the App and get 2 free unlocks

Unlock quizzes for free by uploading documents