Figure: Religion 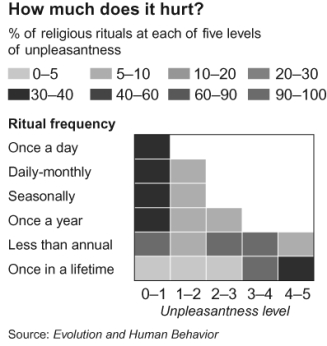 This graph illustrates the work of psychologists Harvey Whitehouse and Quentin Atkinson,as published in the April 23-29,2011 issue of The Economist.The "unpleasantness" of religious rituals (0 is low,5 is high) is along the x-axis.How often the religion requires the ritual to be performed is along the y-axis.What economic concept does this diagram represent?
A) opportunity cost
B) consumer surplus
C) a demand curve
D) an inferior good
Correct Answer:
Verified
Q1: Use the following to answer questions:
Figure: Good
Q2: The quantity demanded is the quantity that
Q3: Which of the following is TRUE about
Q4: Figure: Demand Curve Q5: The demand curve for oil shows: Q6: What does the law of demand state? Q7: Figure: Demand Curve Q9: Quantity demanded: Q10: The demand curve: Q13: Figure: Demand Curve Unlock this Answer For Free Now! View this answer and more for free by performing one of the following actions Scan the QR code to install the App and get 2 free unlocks Unlock quizzes for free by uploading documents![]()
A) the
A)![]()
A) shows how much buyers are
A) shows how much buyers![]()

