Figure: Supply Shift 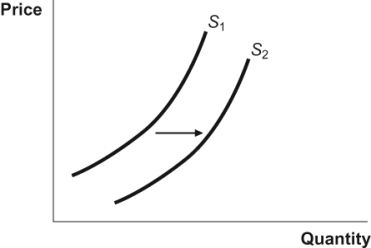 In the figure,a movement from S1 to S2 represents:
A) a decrease in supply.
B) an increase in supply.
C) a decrease in quantity supplied.
D) an increase in quantity supplied.
Correct Answer:
Verified
Q21: The law of demand suggests a _
Q25: Use the following to answer questions:
Figure: Potatoes
Q144: If prices rise, what happens to producer
Q145: When the price of inputs increase:
A) the
Q150: As the price of lead falls (a
Q151: Suppose that Saudi Arabia can produce oil
Q156: A change in which factor would shift
Q160: In the market for fertilizer, an:
A) increase
Q169: A subsidy is a:
A) reverse tax.
B) means
Q171: An increase in production costs at any
Unlock this Answer For Free Now!
View this answer and more for free by performing one of the following actions

Scan the QR code to install the App and get 2 free unlocks

Unlock quizzes for free by uploading documents