Use the following to answer questions
Figure: Aggregate Demand 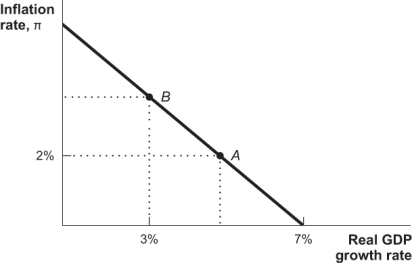
-(Figure: Aggregate Demand) Point B on this aggregate demand curve represents an inflation rate of:
A) 3%.
B) 4%.
C) 5%.
D) 7%.
Correct Answer:
Verified
Q2: Variations in real GDP growth around its
Q3: In the graph of the AD-AS model,what
Q4: During a recession:
A) labor is not fully
Q5: In the graph of the AD-AS model,what
Q6: If the growth rate of money is
Q8: The unemployment rate is expected to _
Q9: The term "business fluctuations" refers to:
A) the
Q10: Business fluctuations are variations in:
A) real income
Q11: Business fluctuations are fluctuations in the:
A) level
Q12: Politicians and especially the general public worry
Unlock this Answer For Free Now!
View this answer and more for free by performing one of the following actions

Scan the QR code to install the App and get 2 free unlocks

Unlock quizzes for free by uploading documents