Use the following to answer questions
Figure: Aggregate Demand 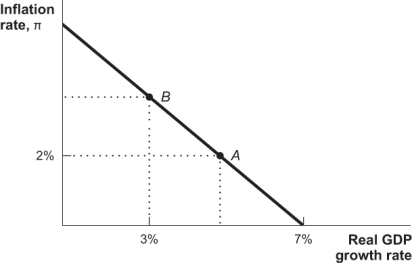
-(Figure: Three Aggregate Demand Curves) Figure: Three Aggregate Demand Curves 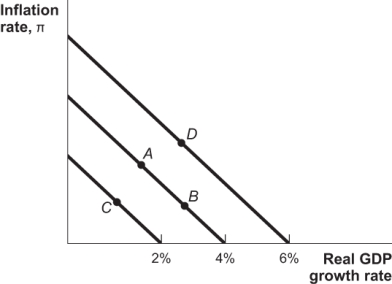 Consider the three aggregate demand curves shown in the graph.Movement from Point A to Point D represents:
A) an increase in spending growth from 2% to 3%.
B) an increase in spending growth from 4% to 6%.
C) an increase in real GDP growth,but not spending growth.
D) an increase in inflation,but not spending growth.
Correct Answer:
Verified
Q22: Other things held constant,an increase in the
Q23: An increase in spending growth will cause
Q24: The aggregate demand curve shows all the
Q25: In the AD-AS model,
Q26: In the AD-AS model,
Q28: Which of the following combinations would be
Q29: All the combinations of inflation and real
Q30: The aggregate demand curve shows the relationship
Q31: The aggregate demand curve shows the relationship
Q32: If the growth rate of the money
Unlock this Answer For Free Now!
View this answer and more for free by performing one of the following actions

Scan the QR code to install the App and get 2 free unlocks

Unlock quizzes for free by uploading documents