Use the following to answer questions: 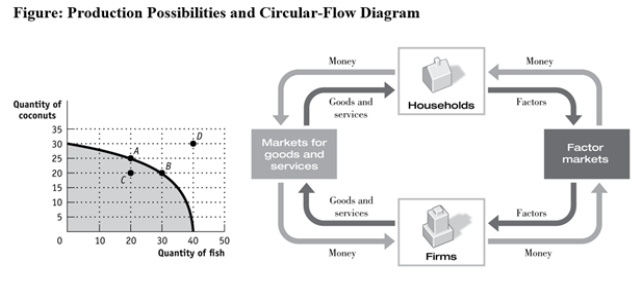
-(Figure: Production Possibilities and Circular-Flow Diagram) Use Figure: Production Possibilities and Circular-Flow Diagram.Assume the two figures represent the same economy.Suppose that in the circular-flow diagram there is a significant decrease in the amount of labour flowing to the firms that produce coconuts.If all other variables remain unchanged,this adjustment in the economy would be BEST represented in the production possibilities figure by a move from point A toward:
A) point A (no movement) .
B) point B (a decrease in coconut production and an increase in fish production) .
C) point C (a decrease in coconut production) .
D) point D (an outward shift of the entire curve) .
Correct Answer:
Verified
Q183: Use the following to answer question:
Q185: Trade takes the form of _ when
Q189: Use the following to answer question:
Q190: Use the following to answer question:
Q193: Which statement is FALSE about the circular-flow
Q194: In the simplest circular-flow model,households supply _
Q196: The circular-flow diagram illustrates how households _
Q197: Which item is NOT a factor of
Q199: The circular-flow diagram represents the market for
Q212: In the circular-flow diagram,the product market is
Unlock this Answer For Free Now!
View this answer and more for free by performing one of the following actions

Scan the QR code to install the App and get 2 free unlocks

Unlock quizzes for free by uploading documents