Use the following to answer question: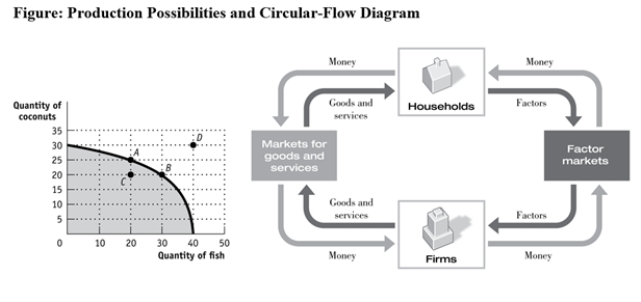
-(Figure: Production Possibilities and Circular-Flow Diagram) Use Figure: Production Possibilities and Circular-Flow Diagram.Assume the two figures represent the same economy.Suppose that in the circular-flow diagram capital that used to flow to firms producing coconuts now flows to firms producing fish.This adjustment in the economy would be BEST represented in the production possibilities figure by a move from point A toward:
A) point A (no movement) .
B) point B (a decrease in coconut production and an increase in fish production) .
C) point C (a decrease in coconut production) .
D) point D (an outward shift of the entire curve) .
Correct Answer:
Verified
Q185: Trade takes the form of _ when
Q186: If the opportunity cost of manufacturing automobiles
Q187: If LeRoyce trades two cookies for one
Q188: The circular-flow diagram illustrates how firms _
Q189: Use the following to answer question:
Q191: Economists are generally in support of:
A)government restrictions
Q192: Use the following to answer question:
Q193: Which statement is FALSE about the circular-flow
Q194: In the simplest circular-flow model,households supply _
Q195: The circular-flow diagram shows how:
A)banks receive deposits
Unlock this Answer For Free Now!
View this answer and more for free by performing one of the following actions

Scan the QR code to install the App and get 2 free unlocks

Unlock quizzes for free by uploading documents