The scatterplot below displays the average longevity (in years) plotted against gestation (in days) for a number of different mammals.For what range of gestation lengths is a linear model appropriate? 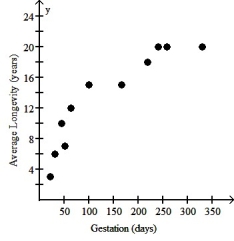
A) A linear model should not be used for any part of the data.
B) One linear model is appropriate for 0 through 200 days and another linear model for 200 through 350 days.
C) A single linear model is appropriate for the entire data set.
D) One linear model is appropriate for 0 through 100 days and another linear model for 150 through 350 days.
E) A linear model should be used for each pair of adjacent data points.
Correct Answer:
Verified
Q14: The scatterplot below displays the yearly production
Q15: Which of the following scatterplots of residuals
Q16: The figure below shows the recent
Q17: Which of the labeled points below are
Q18: Which of the labeled points below will
Q20: The figure below shows the life
Q21: Over a period of years,a certain town
Q22: An economist noticed that nations with more
Q23: The table below displays the latitude
Q24: The figure below shows the association between
Unlock this Answer For Free Now!
View this answer and more for free by performing one of the following actions

Scan the QR code to install the App and get 2 free unlocks

Unlock quizzes for free by uploading documents