The scatterplot below displays world population (in millions) for the years 0 - 1800.Where the population is an estimate,the lower estimate is given.For what range of years is a linear model appropriate? 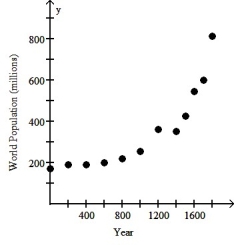
A) One linear model is appropriate for the years 0 through 1000 and another linear model for the years 1400 through 1800.
B) A single linear model is appropriate for the entire data set.
C) One linear model is appropriate for the years 0 through 600 and another linear model for the years 600 through 1800.
D) A linear model should be used for each pair of adjacent data points.
E) A linear model should not be used for any part of the data.
Correct Answer:
Verified
Q6: The data in the table below
Q7: Which of the following scatterplots of residuals
Q8: Which of the labeled points below will
Q9: Which of the labeled points below are
Q10: Which of the following scatterplots of residuals
Q12: Which of the labeled points below are
Q13: Which of the labeled points below are
Q14: The scatterplot below displays the yearly production
Q15: Which of the following scatterplots of residuals
Q16: The figure below shows the recent
Unlock this Answer For Free Now!
View this answer and more for free by performing one of the following actions

Scan the QR code to install the App and get 2 free unlocks

Unlock quizzes for free by uploading documents