The figure below shows the life expectancy for persons living in the U.S.A. 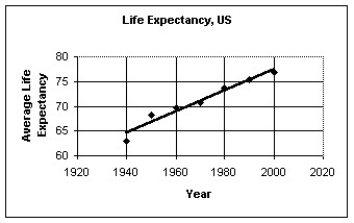 The regression analysis of the data yields the following values: R2 = 0.9539 Use the regression model to predict the life expectancy in 2015.
A) 81 years
B) 79 years
C) 84 years
D) 83 years
E) 80 years
Correct Answer:
Verified
Q15: Which of the following scatterplots of residuals
Q16: The figure below shows the recent
Q17: Which of the labeled points below are
Q18: Which of the labeled points below will
Q19: The scatterplot below displays the average longevity
Q21: Over a period of years,a certain town
Q22: An economist noticed that nations with more
Q23: The table below displays the latitude
Q24: The figure below shows the association between
Q25: A study of consumer behavior finds a
Unlock this Answer For Free Now!
View this answer and more for free by performing one of the following actions

Scan the QR code to install the App and get 2 free unlocks

Unlock quizzes for free by uploading documents