Data collected from 20 students in Statistics classes included their heights (in inches)and weights (in pounds),and are displayed in the following scatterplot.Make a histogram of the weights of the children. 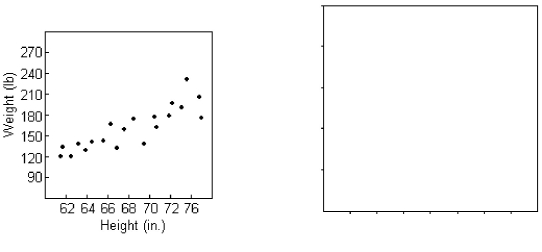
Correct Answer:
Verified
Q19: Q20: Oranges: weight (ounces),oranges: weight (grams) Q21: The following table gives the total Q22: The table contains the daily study Q23: Owners of a new appliances store tracked Q25: A ceramics factory can fire seven large Q26: Below are the Olympic gold medal Q27: The relationship between two quantities x and Q28: One of the important factors determining a Q29: ![]()
A)Positive,linear,strong
B)Positive,nonlinear,moderate
C)Negative,linear,moderate
D)Negative,nonlinear,moderate
E)Positive,no form,strong![]()
Unlock this Answer For Free Now!
View this answer and more for free by performing one of the following actions

Scan the QR code to install the App and get 2 free unlocks

Unlock quizzes for free by uploading documents