The histogram shows the lengths of hospital stays (in hours) for pregnant women admitted to hospitals in Ontario who were having contractions upon arrival. 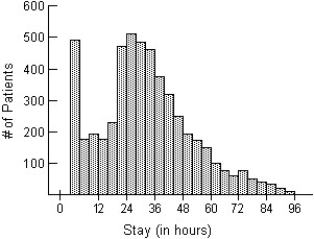
A) The distribution of the length of hospital stays for pregnant patients is skewed to the right,with stays ranging from 1 hour to 96 hours.The distribution is centred around 26 hours,with the majority of stays lasting between 1 to 48 hours.There are relatively few hospital stays longer than 72 hours.Many patients have a stay of only 1-4 hours,possibly because it was not time to deliver.
B) The distribution of the length of hospital stays for pregnant patients is skewed to the right,with stays ranging from 1 hour to 95 hours.The distribution is centred around 26 hours,with the majority of stays lasting between 1 to 48 hours.There are relatively few hospital stays longer than 72 hours.
C) The distribution of the length of hospital stays for pregnant patients is skewed to the right,with stays ranging from 1 hour to 96 hours.The distribution is centred around 26 hours,with the majority of stays lasting between 3 to 24 hours.There are relatively few hospital stays longer than 72 hours.Many patients have a stay of only 1-4 hours,possibly because it was not time to deliver.
D) The distribution of the length of hospital stays for pregnant patients is skewed to the right,with stays ranging from 1 hour to 95 hours.The distribution is centred around 48 hours,with the majority of stays lasting between 24 to 72 hours.There are relatively few hospital stays longer than 72 hours.Many patients have a stay of only 1-3 hours,possibly because it was not time to deliver.
E) The distribution of the length of hospital stays for pregnant patients is skewed to the right,with stays ranging from 1 hour to 95 hours.The distribution is centred around 26 hours,with the majority of stays lasting between 1 to 48 hours.There are relatively few hospital stays longer than 72 hours.Many patients have a stay of only 1-3 hours,possibly because it was not time to deliver.
Correct Answer:
Verified
Q4: Ontario wanted to find the typical size
Q5: The weights,in kilograms,of the members of the
Q6: The data below give the number of
Q7: The display shows the heights of Grade
Q8: Ages of high school students.
A)The distribution would
Q10: A university instructor created a website for
Q11: The diastolic blood pressures,in mm Hg,for a
Q12: Number of times each face of a
Q13: Ages of patients who had their tonsils
Q14: Heights of a group of male professional
Unlock this Answer For Free Now!
View this answer and more for free by performing one of the following actions

Scan the QR code to install the App and get 2 free unlocks

Unlock quizzes for free by uploading documents