The histogram shows the sizes (in acres) of 169 farms in Ontario.In addition to describing the distribution,approximate the percentage of farms that are under 100 acres. 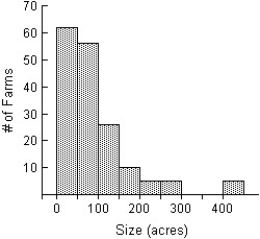
A) The distribution of the size of farms in Ontario is skewed to the right.Most of the farms are smaller than 150 acres,with some larger ones,from 150 to 300 acres.Five farms were larger than the rest,over 400 acres.The mode of the distribution is between 0 and 50 acres.It appears that 118 of 169 farms are under 100 acres,approximately 70%.
B) The distribution of the size of farms in Ontario is symmetric,with farm sizes ranging from 0 to 450 acres.The mode of the distribution is between 0 and 50 acres.It appears that 118 of 169 farms are under 100 acres,approximately 70%.
C) The distribution of the size of farms in Ontario is symmetric,with farm sizes ranging from 0 to 450 acres.The mode of the distribution is between 100 and 150 acres.It appears that 118 of 169 farms are under 100 acres,approximately 70%.
D) The distribution of the size of farms in Ontario is skewed to the right.Most of the farms are smaller than 50 acres,with some larger ones,from 150 to 300 acres.Five farms were larger than the rest,over 400 acres.The mode of the distribution is between 0 and 50 acres.It appears that 118 of 169 farms are under 100 acres,approximately 70%.
E) The distribution of the size of farms in Ontario is skewed to the right.Most of the farms are smaller than 150 acres,with some larger ones,from 150 to 300 acres.Five farms were larger than the rest,over 400 acres.The mode of the distribution is between 0 and 50 acres.It appears that 62 of 169 farms are under 100 acres,approximately 37%.
Correct Answer:
Verified
Q13: Ages of patients who had their tonsils
Q14: Heights of a group of male professional
Q15: The histogram shows the cost of living,in
Q16: In a college health course,65 students participated
Q17: Number of innings in the baseball games
Q19: The diastolic blood pressures,in mm Hg,for a
Q20: The data below represent the midterm grades
Q21: The stem-and-leaf diagram shows the ages
Q22: A weight-loss company used the following histogram
Q23: The histograms display the body fat percentages
Unlock this Answer For Free Now!
View this answer and more for free by performing one of the following actions

Scan the QR code to install the App and get 2 free unlocks

Unlock quizzes for free by uploading documents