Shown below are the histogram and summary statistics for the reading scores of 29 fifth graders. 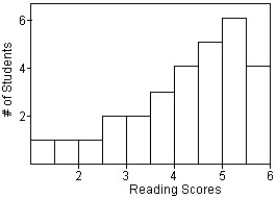 Which measures of centre and spread would you use for this distribution?
A) Mean and IQR,because the data is skewed to the left.
B) Median and standard deviation,because the data is skewed to the left.
C) Mean and standard deviation,because the data is skewed to the left.
D) Mean and standard deviation,because the data is symmetric.
E) Median and IQR,because the data is skewed to the left.
Correct Answer:
Verified
Q33: A small company employs a supervisor at
Q34: The mathematics department at a Canadian
Q35: A business owner recorded her annual
Q36: A student at a local university
Q37: The following stem-and-leaf display shows the
Q39: Students were asked to make a
Q40: A dotplot of the number of tornadoes
Q41: Here are the number of baseball games
Q42: Here are the grocery bills,in dollars,for
Q43: Jody got a bank statement each month
Unlock this Answer For Free Now!
View this answer and more for free by performing one of the following actions

Scan the QR code to install the App and get 2 free unlocks

Unlock quizzes for free by uploading documents