The back-to-back dotplot shows the number of fatalities per year caused by tornadoes in a certain state for two periods: 1950-1974 and 1975-1999.Explain how you would summarize the centre and spread of each of the variables depicted in the dotplots. 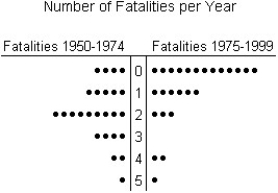
A) The distribution of the number of fatalities per year for the period 1950-1974 is unimodal and approximately symmetric.Therefore,we would be satisfied using the mean to summarize the centre and the standard deviation to summarize spread.For the period 1975-1999,the distribution of the number of fatalities per year is also unimodal,but skewed to the right.Therefore,we would prefer to use a median for centre and an IQR to summarize spread.
B) The distribution of the number of fatalities per year for the period 1950-1974 is unimodal,but skewed to the right.Therefore,we would prefer to use a median for centre and an IQR to summarize spread.For the period 1975-1999,the distribution is also unimodal and approximately symmetric.Therefore,we would be satisfied using the mean to summarize the centre and the standard deviation to summarize spread.
C) The distribution of the number of fatalities per year for the period 1950-1974 is bimodal.Therefore,we would prefer to use a median to summarize the centre and an IQR to summarize spread.For the period 1975-1999,the distribution of the number of fatalities per year is also bimodal,but skewed to the left.Therefore,we would prefer to use a mean for centre and a standard deviation to summarize spread.
D) The distribution of the number of fatalities per year for the period 1950-1974 is unimodal and approximately symmetric.Therefore,we would prefer to use the median to summarize the centre and the standard deviation to summarize spread.For the period 1975-1999,the distribution of the number of fatalities per year is also unimodal,but skewed to the right.Therefore,we would prefer to use the mean for centre and an IQR to summarize spread.
E) The distribution of the number of fatalities per year for the period 1950-1974 is unimodal but skewed to the right.Therefore,we would prefer to use a median to summarize the centre and IQR to summarize spread.For the period 1975-1999,the distribution of the number of fatalities per year is also unimodal and skewed to the right.Therefore,we would prefer to use a median for centre and an IQR to summarize spread.
Correct Answer:
Verified
Q55: Last year,nine employees of an electronics company
Q56: A particular student has a grade point
Q57: Last weekend police ticketed 18 men whose
Q58: The employees at Frank's Furniture earned
Q59: Here are some scores from a recent
Q61: A small company employs a supervisor at
Q62: A new business had the following monthly
Q63: The weekly salaries,in dollars,of 16 government workers
Q64: The test scores of 15 students are
Q65: Here are costs (in dollars)of 12
Unlock this Answer For Free Now!
View this answer and more for free by performing one of the following actions

Scan the QR code to install the App and get 2 free unlocks

Unlock quizzes for free by uploading documents