Solved

Here Are the Summary Statistics for Mathematics Scores for One

Question 108

Multiple Choice

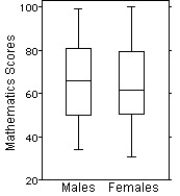
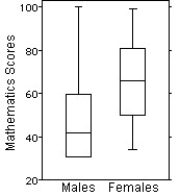
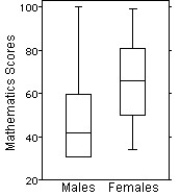
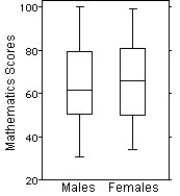
Here are the summary statistics for mathematics scores for one high-school graduating class. n Mean  Median  SD  Min  Max  Q1  Q3  Male 17606318.6301005278 Female 18656617.736985080\begin{array} { l | c | c | c | c | c | c | c | c } & \mathbf { n } & \text { Mean } & \text { Median } & \text { SD } & \text { Min } & \text { Max } & \text { Q1 } & \text { Q3 } \\\hline \text { Male } & 17 & 60 & 63 & 18.6 & 30 & 100 & 52 & 78 \\\text { Female } & 18 & 65 & 66 & 17.7 & 36 & 98 & 50 & 80\end{array} Choose the boxplot that represents the given data.
I  Here are the summary statistics for mathematics scores for one high-school graduating class.  \begin{array} { l | c | c | c | c | c | c | c | c }  & \mathbf { n } & \text { Mean } & \text { Median } & \text { SD } & \text { Min } & \text { Max } & \text { Q1 } & \text { Q3 } \\ \hline \text { Male } & 17 & 60 & 63 & 18.6 & 30 & 100 & 52 & 78 \\ \text { Female } & 18 & 65 & 66 & 17.7 & 36 & 98 & 50 & 80 \end{array}  Choose the boxplot that represents the given data.  I     II     III    IV     V   A) I B) II C) III D) IV E) V
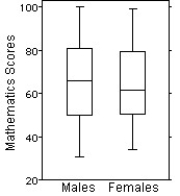
II
 Here are the summary statistics for mathematics scores for one high-school graduating class.  \begin{array} { l | c | c | c | c | c | c | c | c }  & \mathbf { n } & \text { Mean } & \text { Median } & \text { SD } & \text { Min } & \text { Max } & \text { Q1 } & \text { Q3 } \\ \hline \text { Male } & 17 & 60 & 63 & 18.6 & 30 & 100 & 52 & 78 \\ \text { Female } & 18 & 65 & 66 & 17.7 & 36 & 98 & 50 & 80 \end{array}  Choose the boxplot that represents the given data.  I     II     III    IV     V   A) I B) II C) III D) IV E) V
III
 Here are the summary statistics for mathematics scores for one high-school graduating class.  \begin{array} { l | c | c | c | c | c | c | c | c }  & \mathbf { n } & \text { Mean } & \text { Median } & \text { SD } & \text { Min } & \text { Max } & \text { Q1 } & \text { Q3 } \\ \hline \text { Male } & 17 & 60 & 63 & 18.6 & 30 & 100 & 52 & 78 \\ \text { Female } & 18 & 65 & 66 & 17.7 & 36 & 98 & 50 & 80 \end{array}  Choose the boxplot that represents the given data.  I     II     III    IV     V   A) I B) II C) III D) IV E) V
IV  Here are the summary statistics for mathematics scores for one high-school graduating class.  \begin{array} { l | c | c | c | c | c | c | c | c }  & \mathbf { n } & \text { Mean } & \text { Median } & \text { SD } & \text { Min } & \text { Max } & \text { Q1 } & \text { Q3 } \\ \hline \text { Male } & 17 & 60 & 63 & 18.6 & 30 & 100 & 52 & 78 \\ \text { Female } & 18 & 65 & 66 & 17.7 & 36 & 98 & 50 & 80 \end{array}  Choose the boxplot that represents the given data.  I     II     III    IV     V   A) I B) II C) III D) IV E) V
V
 Here are the summary statistics for mathematics scores for one high-school graduating class.  \begin{array} { l | c | c | c | c | c | c | c | c }  & \mathbf { n } & \text { Mean } & \text { Median } & \text { SD } & \text { Min } & \text { Max } & \text { Q1 } & \text { Q3 } \\ \hline \text { Male } & 17 & 60 & 63 & 18.6 & 30 & 100 & 52 & 78 \\ \text { Female } & 18 & 65 & 66 & 17.7 & 36 & 98 & 50 & 80 \end{array}  Choose the boxplot that represents the given data.  I     II     III    IV     V   A) I B) II C) III D) IV E) V


A) I
B) II
C) III
D) IV
E) V

Correct Answer:

verifed

Verified

Unlock this answer now
Get Access to more Verified Answers free of charge

Related Questions

Unlock this Answer For Free Now!

View this answer and more for free by performing one of the following actions

qr-code

Scan the QR code to install the App and get 2 free unlocks

upload documents

Unlock quizzes for free by uploading documents