Shown below are the boxplot,the histogram and summary statistics for the highest temperatures ever recorded (in °F) in 32 different states in the U.S.A.. 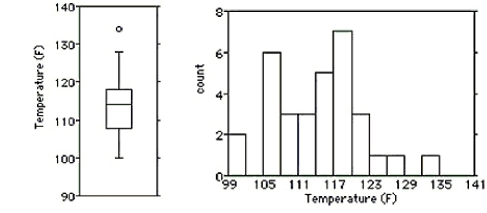 Write a few sentences describing the distribution.
A) The distribution is bimodal,symmetric with a mean of 114.2°F.There is a high outlier that should be investigated.The standard deviation is 7.7°F.The boxplot shows that half of the time,the highest temperatures were between about 107.5°F and 114°F.
B) The distribution is unimodal,symmetric enough with a mean of 114.2°F.There is a high outlier that should be investigated,but it does not influence the mean very much.The standard deviation is 7.7°F.The boxplot shows that half of the time,the highest temperatures were between about 107.5°F and 118°F.
C) The distribution is bimodal,essentially symmetric with a mean of 114.2°F.There is a high outlier that should be investigated,but it does not influence the mean very much.The standard deviation is 7.7°F.The boxplot shows that half of the time,the highest temperature were between about 107.5°F and 118°F.
D) The distribution is unimodal,essentially symmetric with a mean of 114.2°F.There is a high outlier that should be investigated,because it influences the mean.The standard deviation is 7.7°F.The boxplot shows that half of the time,the highest temperatures were between about 107.5°F and 114°F.
E) The distribution is unimodal,essentially symmetric with a mean of 114.2°F.There is a high outlier that should be investigated,but it does not influence the mean very much.The standard deviation is 7.7°F.The boxplot shows that half of the time,the highest temperatures were between about 107.5°F and 114°F.
Correct Answer:
Verified
Q138: Here are summary statistics for the
Q139: Here are some summary statistics for
Q140: Here are some summary statistics for
Q141: Shown below are the boxplot,the histogram
Q142: A medical study of the effects
Q144: Here are summary statistics for the
Q145: Here are summary statistics for the
Q146: A class of sixth graders takes a
Q147: Shown below are the boxplot,the histogram
Q148: Here is the boxplot and an ogive
Unlock this Answer For Free Now!
View this answer and more for free by performing one of the following actions

Scan the QR code to install the App and get 2 free unlocks

Unlock quizzes for free by uploading documents