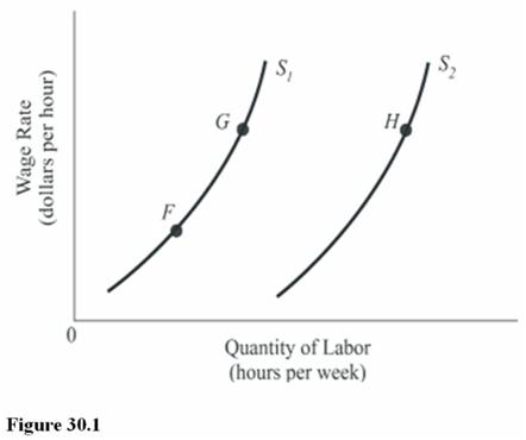
 In Figure 30.1, the shift in the labor supply curve from S1 to S2 means that
A) The marginal utility of labor has decreased.
B) Workers are being paid higher wage rates, given their taste for work.
C) The marginal utility of labor relative to leisure has increased.
D) The demand for labor has increased, and this encourages more labor force participation.
Correct Answer:
Verified
Q16: If Lauren's substitution effects outweigh her income
Q24: If there is an increase in the
Q35: If Janella increases her supply of labor
Q37: If payroll taxes are increased,there will be
Q38: Which of the following is not true
Q43: The change in total revenue associated with
Q44: The marginal revenue product establishes
A)An upper limit
Q44: The marginal revenue product of labor is
Q45: The determinants of labor demand include
A) Marginal
Q60: Which of the following would not shift
Unlock this Answer For Free Now!
View this answer and more for free by performing one of the following actions

Scan the QR code to install the App and get 2 free unlocks

Unlock quizzes for free by uploading documents