Multiple Choice
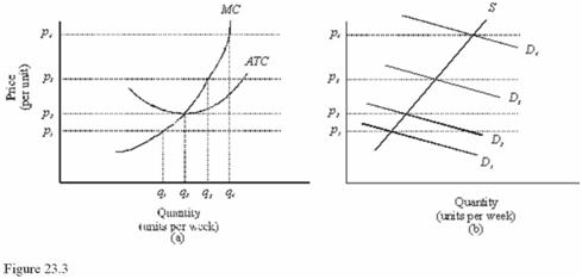 In Figure 23.3, diagram "a" presents the cost curves that are relevant to a firm's production decision, and diagram "b" shows the market demand and supply curves for the market.Use both diagrams to answer the following question: In the long run, at prices below p2 in Figure 23.3,
A) There is economic profit.
B) The firm will produce the quantity where MC = MR.
C) Firms will enter the market.
D) Firms will exit the market.
Correct Answer:
Verified
Related Questions
Q70: Technological improvements cause
A)ATC to shift down.
B)The supply
Q76: Marginal cost pricing means that a firm
A)Produces
Q77: In a perfectly competitive market where firms

