Which panel of Figure 3.3 represents the changes in the market for beef when the price of corn cattle feed) rises and the people become more fearful of mad cow disease? Figure 3.3 Shifts of Supply and Demand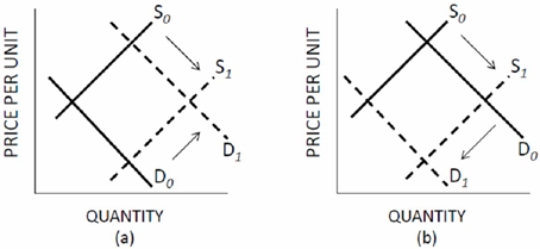
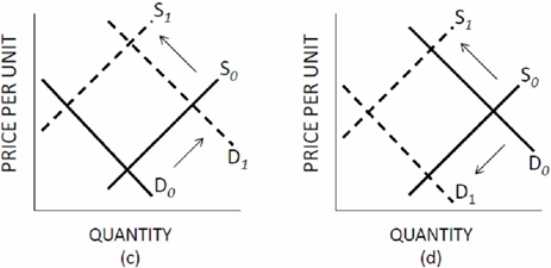
A) A
B) B.
C) C.
D) D.
Correct Answer:
Verified
Q102: If the price of "X" increases and
Q105: One In the News article in the
Q106: If the market wage for fast-food restaurants
Q112: If the market wage for fast-food restaurants
Q114: If corn products are found to cause
Q115: Which panel of Figure 3.3 represents the
Q116: If the government required the actual market
Q118: The In the News article titled "Seafood
Q122: A decrease in the price of bubble
Q155: A change in price changes the quantity
Unlock this Answer For Free Now!
View this answer and more for free by performing one of the following actions

Scan the QR code to install the App and get 2 free unlocks

Unlock quizzes for free by uploading documents