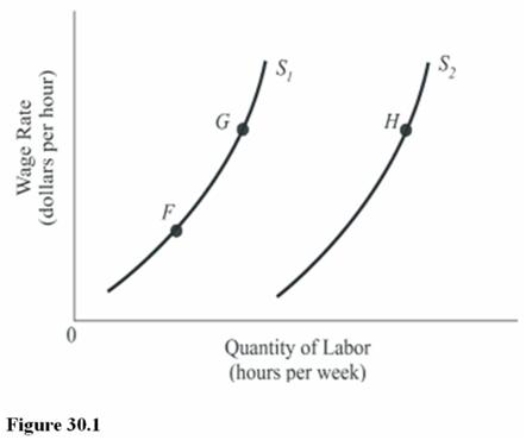
 In Figure 30.1, the shift in the labor supply curve from S1 to S2 means that
A) The marginal utility of labor has decreased.
B) Workers are being paid higher wage rates, given their taste for work.
C) The marginal utility of labor relative to leisure has increased.
D) The demand for labor has increased, and this encourages more labor force participation.
Correct Answer:
Verified
Q21: The elasticity of labor supply does not
Q21: The market supply of labor is
A) The
Q26: Jackson hates to work.He receives a great
Q28: The market supply curve for labor curve
Q33: The elasticity of labor supply measures the
A)Opportunity
Q35: If Janella increases her supply of labor
Q37: If payroll taxes are increased,there will be
Q38: Which of the following is not true
Q39: If leisure activities become more attractive,there will
Q40: If Anh's elasticity of labor supply is
Unlock this Answer For Free Now!
View this answer and more for free by performing one of the following actions

Scan the QR code to install the App and get 2 free unlocks

Unlock quizzes for free by uploading documents