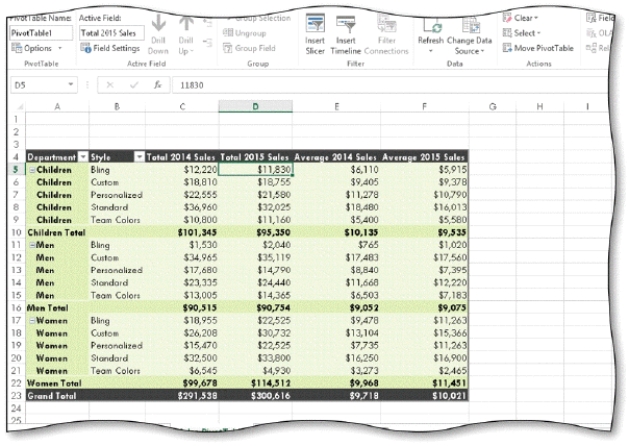
-You can filter the PivotTable report shown in the accompanying figure by ____.
A) Total 2014 Sales
B) Department and Style
C) Total 2015 Sales
D) Average 2014 Sales
Correct Answer:
Verified
Q1: The _ value is a number from
Q2: A _ is an interactive view of
Q3: Which of the following is the path
Q4: Which of the following is the path
Q6: Which of the following is the path
Q7: A _ report is an interactive chart
Q8: Which of the following is the path
Q9: In a PivotTable, _ fields correspond to
Q10: You can add a trendline to all
Q11: Which of the following is the path
Unlock this Answer For Free Now!
View this answer and more for free by performing one of the following actions

Scan the QR code to install the App and get 2 free unlocks

Unlock quizzes for free by uploading documents