The graph of a company's total cost function is shown. Does this total cost function represent a manufacturing process that is getting more efficient or less efficient as the production level increases? 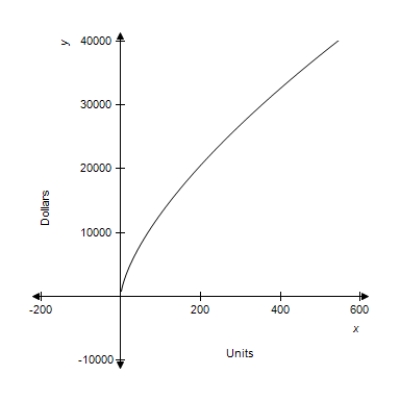
A) less efficient
B) more efficient
Correct Answer:
Verified
Q219: Find the indicated derivative. Find 
Q220: Find the indicated derivative. Find
Q221: Total revenue is in dollars and x
Q222: The following table shows the numbers of
Q223: The following table shows the numbers of
Q225: In this problem, cost is in dollars
Q226: The graph of a company's total cost
Q227: Total revenue is in dollars and x
Q228: Total revenue is in dollars and x
Q229: Suppose that the cost function for a
Unlock this Answer For Free Now!
View this answer and more for free by performing one of the following actions

Scan the QR code to install the App and get 2 free unlocks

Unlock quizzes for free by uploading documents