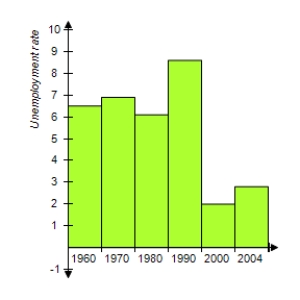
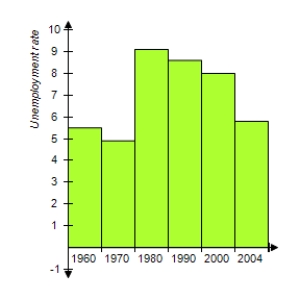
The following table gives a city's unemployment rates for civilian workers for selected years from 1960 to 2004. Which bar graph represents the information given in the table? 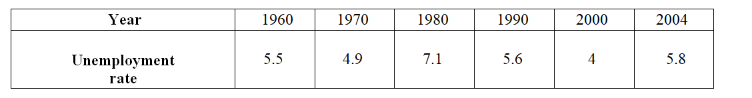
A)
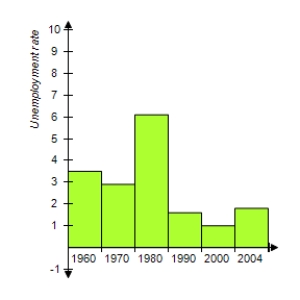
B)
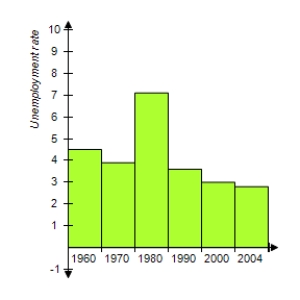
C)
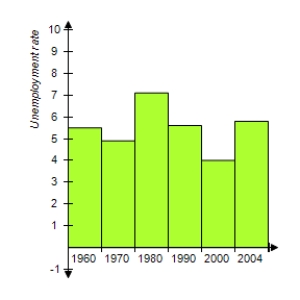
D)
E)
Correct Answer:
Verified
Q25: Find the standard deviation of the sample
Q25: Find the mode(s) of the scores.
11,
Q26: In a certain community, 45% of the
Q26: Find the mode of the set of
Q27: Find the mean of the following data.
Q29: Which list of data is displayed in
Q30: A quiz consists of 10 multiple-choice questions
Q34: Find the median of the set of
Q35: Find the range of the set of
Q40: Find the variance of the set of
Unlock this Answer For Free Now!
View this answer and more for free by performing one of the following actions

Scan the QR code to install the App and get 2 free unlocks

Unlock quizzes for free by uploading documents