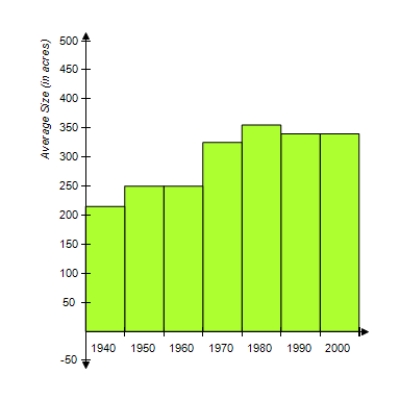
The following bar graph shows the size of the average farm (in acres) for selected years from 1940 to 2000. Which table shows the data displayed in the graph? 
A) 
B) 
C) 
D) 
E) 
Correct Answer:
Verified
Q21: Find the median of the set of
Q23: Find the mean of the set of
Q24: Find the mean of the scores.
7,
Q39: Which frequency table best describes the data
Q39: A company produces shotgun shells in batches
Q42: Determine y, if possible, so that the
Q43: Determine c, if possible, so that the
Q44: The birth weights (in kilograms) of a
Q45: The table below gives the votes in
Q46: A new car with a $19,700 list
Unlock this Answer For Free Now!
View this answer and more for free by performing one of the following actions

Scan the QR code to install the App and get 2 free unlocks

Unlock quizzes for free by uploading documents