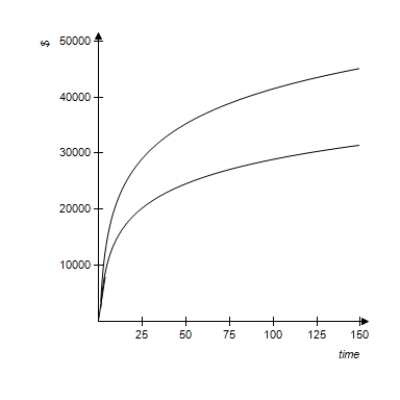
The following figure shows a graph that compares the present values of two ordinary annuities of $800 quarterly as functions of the number of quarters. One annuity is at an annual rate of 6% compounded quarterly, and the other is at an annual rate of 9% compounded quarterly. Use the graph below to estimate the difference between the present values of these annuities for 25 years (100 quarters) .
A) $36,000
B) $4,800
C) $30,000
D) $125
E) $9,586
Correct Answer:
Verified
Q63: State whether the problem relates to an
Q75: How much is needed in an account
Q76: Suppose a young couple deposits $1,100 at
Q77: A young executive deposits $200 at the
Q79: Gail Kelley deposits $600 in an account
Q85: Decide whether the problem relates to an
Q85: An annuity consists of payments of $600
Q86: A professional athlete invested $3.1 million of
Q86: If $91,000 is invested in an annuity
Q91: Suppose that Craig Nordstrom deposits his $11,500
Unlock this Answer For Free Now!
View this answer and more for free by performing one of the following actions

Scan the QR code to install the App and get 2 free unlocks

Unlock quizzes for free by uploading documents