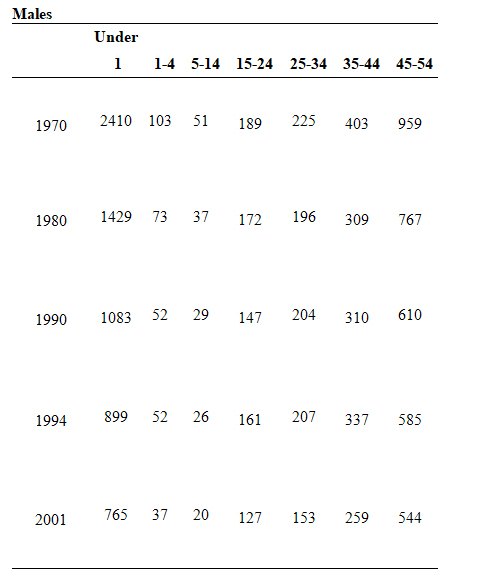
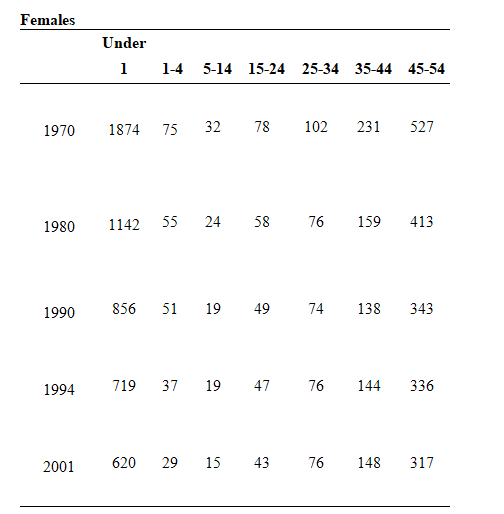
The following tables give the death rates, per 100,000 population, by age for selected years for males and females. If matrix M gives the male data and matrix F gives the female data, find matrix M - F and describe what it means.
A) 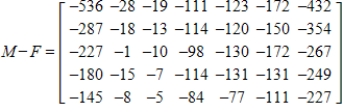
M - F represents how much greater the numbers are for males in each category per year.
B) 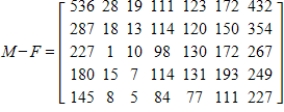
M - F represents how much greater the numbers are for males in each category per year.
C) 
M - F represents how much greater the numbers are for females in each category per year.
D)  M - F represents how much greater the numbers are for females in each category per year.
E) 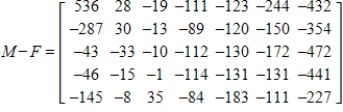 M - F represents only the male death rates, per 100,000 population by age.
Correct Answer:
Verified
Q18: Use the following matrices to perform the
Q19: Use the following matrices to perform the
Q20: What is the sum of matrix M
Q21: The following tables give the rank and
Q22: A poll of 3620 people revealed that
Q24: The tables below give the numbers of
Q25: Find x, y, z and w.
Q26: Find x, y, z, and w .
Q27: The following tables give the death rates,
Q28: Using the data in the following tables,
Unlock this Answer For Free Now!
View this answer and more for free by performing one of the following actions

Scan the QR code to install the App and get 2 free unlocks

Unlock quizzes for free by uploading documents