Suppose that the following table shows the number of millions of people in the United States who lived below the poverty level for selected years. Find a cubic model that approximately fits the data, using x as the number of years after 1960. Round numerical values in your answer to four decimal places. Depending on the technology you use, your answer may be slightly different than the correct answer shown. 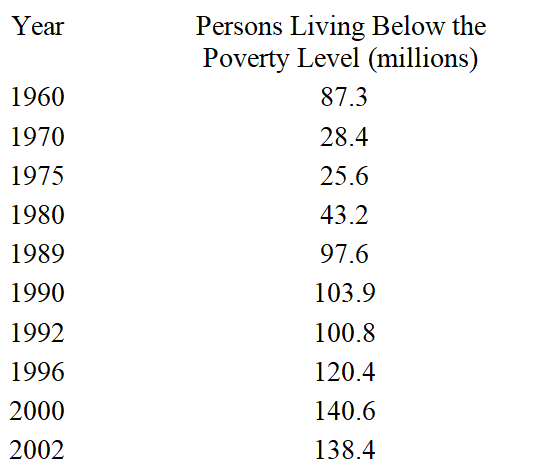
A) 
B) 
C) 
D) 
E) 
Correct Answer:
Verified
Q100: By recognizing shapes and features of rational
Q101: The table gives the median household income
Q102: Suppose the IQ scores (rounded to the
Q103: Find the equation of the linear function
Q104: Determine what type of function best models
Q106: Graph the power function that models the
Q107: Suppose that the following table gives the
Q108: The table below shows the national expenditures
Q109: Graph the linear function that models the
Q110: Suppose the following table gives the U.S.
Unlock this Answer For Free Now!
View this answer and more for free by performing one of the following actions

Scan the QR code to install the App and get 2 free unlocks

Unlock quizzes for free by uploading documents