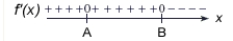
Use the sign diagram for  to determine x-values at which relative maxima occur, where
  and
and  .
. 
A) 
B) 
C)  and
and 
D) 
E) no relative maxima
Correct Answer:
Verified
Q12: Use the graph of Q13: For the given function, find all critical Q14: For the given function, find Q15: For the given function, find all intervals Q16: For the given function and graph, determine Q18: For the given function and graph, estimate Q19: For the given function and graph, estimate Q20: Use the sign diagram for Q21: For the given function, find intervals of Q22: For the given function, classify the critical![]()

Unlock this Answer For Free Now!
View this answer and more for free by performing one of the following actions

Scan the QR code to install the App and get 2 free unlocks

Unlock quizzes for free by uploading documents