The following figure shows the growth of a population as a function of time. 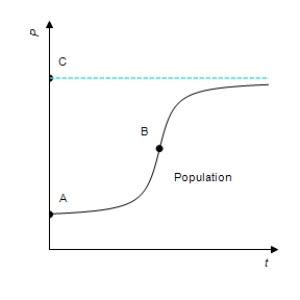 If P represents the population and t represents the time, write a mathematical symbol that represents the rate of change (growth rate) of the population with respect to time.
A) 
B) 
C) 
D) 
E) 
Correct Answer:
Verified
Q63: The following figure shows the growth of
Q64: Use the graph shown in the figure
Q65: Use the graph shown in the figure
Q66: A function and its graph are given.
Q67: Use the graph shown in the figure
Q69: A function and its first and second
Q70: A function and its graph are given.
Q71: In this problem, Q72: A function and its graph are given. Q73: A function and its first and second![]()
Unlock this Answer For Free Now!
View this answer and more for free by performing one of the following actions

Scan the QR code to install the App and get 2 free unlocks

Unlock quizzes for free by uploading documents