Multiple Choice
The following figure shows the growth of a population as a function of time. 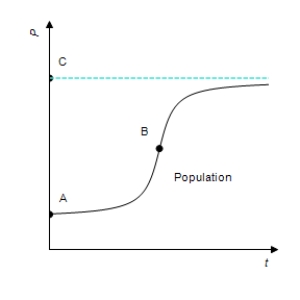 Which of A, B, and/or C correspond(s) to the upper limit of population?
A) B
B) C
C) A
D) B and A
E) none of the above
Correct Answer:
Verified
Related Questions
Q86: The consumer price data can be modeled
Q87: If the total cost function for a
Q88: Suppose that the total number of units
Q89: A firm has total revenue given by

Unlock this Answer For Free Now!
View this answer and more for free by performing one of the following actions

Scan the QR code to install the App and get 2 free unlocks

Unlock quizzes for free by uploading documents