The figure shows the graph of the position x as a function of time for an object moving in the straight line (the x-axis) . Which of the following graphs best describes the velocity along the x-axis as a function of time for this object? 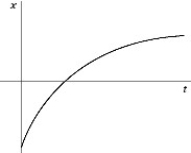
A) 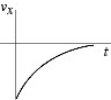
B) 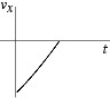
C) 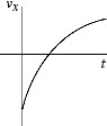
D) 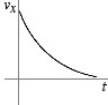
E) 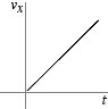
Correct Answer:
Verified
Q2: The motion of a particle is described
Q3: An object is moving in a straight
Q4: The motions of a car and a
Q8: A ball is thrown directly upward and
Q9: Which one of the following graphs could
Q10: An object is moving with constant non-zero
Q11: Suppose that an object is moving with
Q11: An object starts its motion with a
Q17: When can we be certain that the
Q20: If an object is accelerating toward a
Unlock this Answer For Free Now!
View this answer and more for free by performing one of the following actions

Scan the QR code to install the App and get 2 free unlocks

Unlock quizzes for free by uploading documents