Use the following graph and information to answer the question below.
Flycatcher birds that migrate from Africa to Europe feed their nestlings a diet that is almost exclusively moth caterpillars. The graph shows the mean dates of arrival, bird hatching, and peak caterpillar season for the years 1980 and 2000. 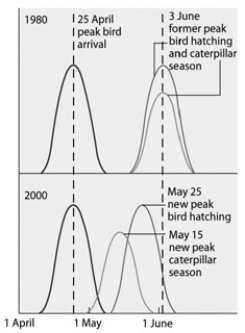
The shift in the peak of caterpillar season is most likely due to ________.
A) pesticide use
B) earlier migration returns of flycatchers
C) an innate change in the biological clock of the caterpillars
D) global warming
E) acid precipitation in Europe
Correct Answer:
Verified
Q43: Global warming refers to _.
A) the increase
Q44: Q45: A 3-hectare lake in the American Midwest Q46: Which of the following are TRUE about Unlock this Answer For Free Now! View this answer and more for free by performing one of the following actions Scan the QR code to install the App and get 2 free unlocks Unlock quizzes for free by uploading documents![]()

