Use the accompanying figure and information to answer the question(s) below. 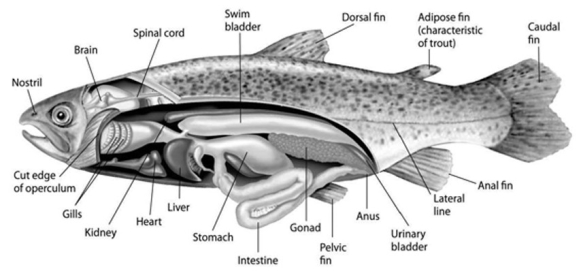
-Which graph properly depicts the relationship between the amount of gas in the swim bladder and the density of the fish?
A) 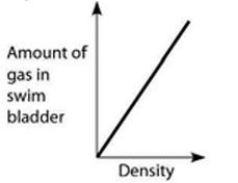
B) 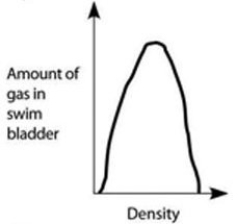
C) 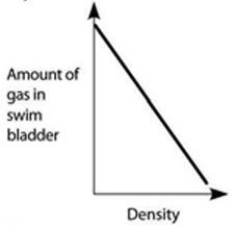
D) 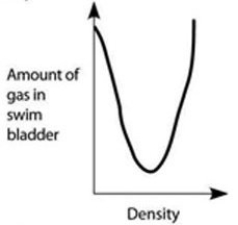
E) 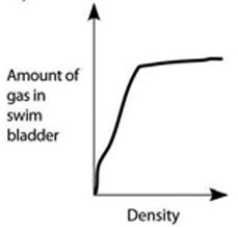
Graph with density on the x-axis and amount of gas in swim bladder on the y-axis. Both axes are unscaled, increasing. A line increases steeply from the origin and then flattens near the top of the y-axis.
Correct Answer:
Verified
Q19: Which of the following is a characteristic
Q23: Use the following information to answer the
Q25: Which group's members have both lungs and
Q27: Internal fertilization, a leathery amniotic egg, and
Q29: What group of mammals have (a) embryos
Q38: The evolution of similar insulating skin coverings
Q80: The following questions refer to the description
Q96: The following questions refer to the description
Q102: Vertebrates and tunicates share
A) jaws adapted for
Q109: Which of the following could be considered
Unlock this Answer For Free Now!
View this answer and more for free by performing one of the following actions

Scan the QR code to install the App and get 2 free unlocks

Unlock quizzes for free by uploading documents