Multiple Choice
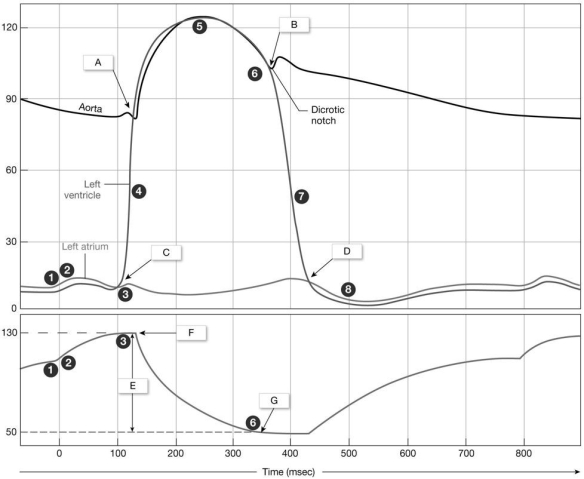 Figure 18-2
-What does the circle label "5" indicate on the graph?
A) peak systolic pressure
B) isovolumetric systole
C) isovolumetric contraction
D) ventricular refilling
E) increased heart rate
Correct Answer:
Verified
Related Questions
Q63: The P wave of the electrocardiogram is
Q92: Pacemaker cells in the SA node
A)have a
Q95: In cardiac muscle,the fast depolarization phase of
Q96: The long plateau phase of the cardiac
Q98: If the pacemaker cells in the SA
Q99: The T wave on an ECG tracing
Q99: If the connection between the SA node
Unlock this Answer For Free Now!
View this answer and more for free by performing one of the following actions

Scan the QR code to install the App and get 2 free unlocks

Unlock quizzes for free by uploading documents