Use the graph below to answer questions 17- 20.
Figure 1.2 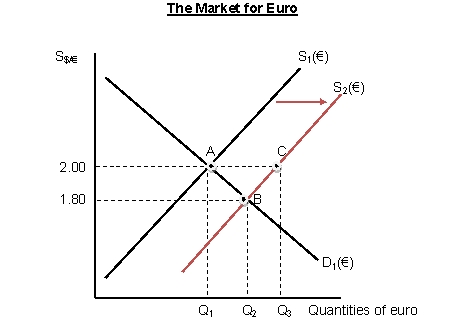
-Refer to Figure 1.2.Suppose that the market for euro is initially in equilibrium at point A with the exchange rate $2.00 per euro.When the supply curve shifts to S2,the euro ___________ and the quantities of euro traded in the market __________.
A) appreciates; increases
B) appreciates; decreases
C) depreciates; increases
D) depreciates, decreases
Correct Answer:
Verified
Q11: The exchange rate is
A)the price of one
Q15: You have obtained the following spot rates:
Q16: Use the graph below to answer questions
Q17: If the French demand for American exports
Q18: Assume that Citibank quotes you a buy
Q19: If the spot exchange rate goes from
Q21: Which of the following countries has the
Q22: The Citibank trading desk quotes a buy
Q24: If the price of British pounds in
Q25: Assume that the dollar value of a
Unlock this Answer For Free Now!
View this answer and more for free by performing one of the following actions

Scan the QR code to install the App and get 2 free unlocks

Unlock quizzes for free by uploading documents