Use the graph below to answer questions 17- 20.
Figure 1.2 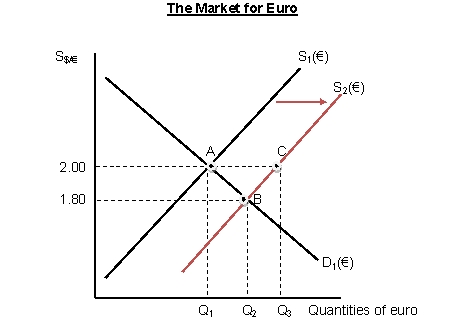
-Refer to Figure 1.2.Suppose that the market for euro is initially in equilibrium at point A with the exchange rate $2.00 per euro.Then the supply curve shifts to S2.If the European central bank wants to fix the exchange rate at $2.00/euro,they have to:
A) buy euro and sell dollar by the amount of Q3 - Q1.
B) sell euro and buy dollar by the amount of Q3 - Q1.
C) sell only euro by the amount of Q3 - Q1 and leave dollar alone.
D) buy only euro by the amount of Q3 - Q1 and leave dollar alone.
Correct Answer:
Verified
Q6: Use the following information about the spot
Q7: Suppose that Citibank buys a large amount
Q8: Suppose the dollar price of Thai baht
Q9: Rising income in China triggers an increase
Q10: You have accessed the following spot rates:
U.S.dollar
Q12: Use the following information about the spot
Q13: Use the graph below to answer questions
Q14: Rising income in the United States triggers
Q15: You have obtained the following spot rates:
Q16: Use the graph below to answer questions
Unlock this Answer For Free Now!
View this answer and more for free by performing one of the following actions

Scan the QR code to install the App and get 2 free unlocks

Unlock quizzes for free by uploading documents