Based on the situation depicted in the graph below, which of the following would be an appropriate fiscal policy response? 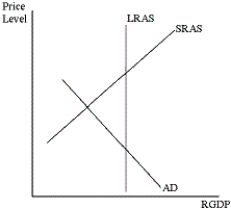
A) increase taxes
B) decrease taxes
C) decrease government purchases
D) all of the above
E) both A and C above
Correct Answer:
Verified
Q27: The extent of the multiplier effect visible
Q38: To achieve a $500 billion increase in
Q55: If government increases its purchases by $20
Q55: A combination of an increase in investment
Q57: A decrease in taxes will do which
Q58: If MPC = 0.75, a $40 billion
Q59: An increase in taxes will do which
Q60: A decrease in transfer payments would not
Q61: Obama economists believe that the multiplier for
Q111: Each additional round of the multiplier process
Unlock this Answer For Free Now!
View this answer and more for free by performing one of the following actions

Scan the QR code to install the App and get 2 free unlocks

Unlock quizzes for free by uploading documents