Figure 10-A 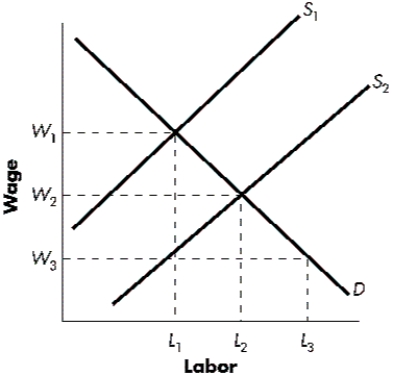
-Refer to Figure 10-A.In the diagram, when unions successfully increase the wages of its members, the supply curve in the union sector shifts from ____ and ____ workers lose their jobs as a result.
A) S1 to S2; L3 - L1
B) S2 to S1; L3 - L1
C) S1 to S2; L2 - L1
D) S2 to S1; L2 - L1
E) S2 to S1; L2
Correct Answer:
Verified
Q86: When the economy is in a recession,_
Q88: Under a progressive tax system:
A) only the
Q97: With a negative income tax featuring an
Q151: Which of the following countries has the
Q153: Exhibit 10-A
Several congressmen and senators have been
Q154: The poverty rate in the United States
Q155: Exhibit 10-A
Several congressmen and senators have been
Q159: Ceteris paribus, if the cost of feeding
Q160: The official poverty rate for the United
Q176: If a large number of skilled workers
Unlock this Answer For Free Now!
View this answer and more for free by performing one of the following actions

Scan the QR code to install the App and get 2 free unlocks

Unlock quizzes for free by uploading documents