Exhibit 9-A
The following diagram depicts monopolistically competitive firms. 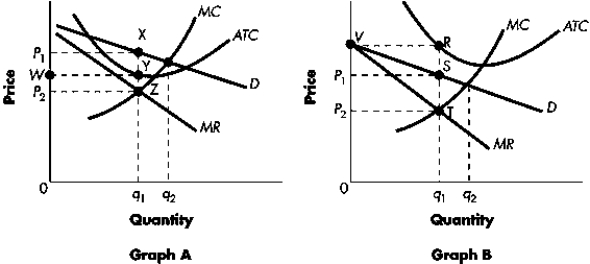
-Refer to Exhibit 9-A.The firm illustrated in Graph A above maximizes profits (minimizes losses) by producing at level of output ____ and charging price ____.
A) q1; P1
B) q2; P1
C) q1; P2
D) q2; P2
E) None of the above.
Correct Answer:
Verified
Q84: The tools of "game theory" are most
Q87: In the "Prisoners' Dilemma" game:
A) both players
Q88: At a Nash equilibrium:
A) each firm is
Q91: Which is the following is true of
Q98: If the firms in an industry represented
Q99: A dominant strategy is:
A) one that maximizes
Q152: Which of the following is a correct
Q153: In the "Prisoners' Dilemma" game:
A)each player would
Q157: When firms are faced with making strategic
Q160: When the player of a game chooses
Unlock this Answer For Free Now!
View this answer and more for free by performing one of the following actions

Scan the QR code to install the App and get 2 free unlocks

Unlock quizzes for free by uploading documents