Figure 8-C
The following diagram contains information on cost and revenue curves facing a regulated monopoly. 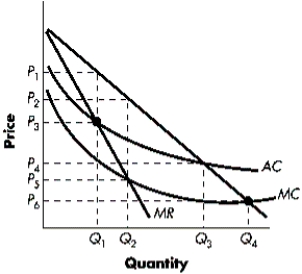
-Refer to Figure 8-C.The socially efficient level of output would occur where:
A) price equals average total cost at Q3.
B) price equals marginal cost at Q4.
C) price equals marginal revenue at Q1.
D) marginal revenue equals marginal cost at Q2.
E) None of the above.
Correct Answer:
Verified
Q149: Figure 8-D Q151: Figure 8-C Q156: Figure 8-C Q157: Table 8-B Q158: Table 8-B![]()
The following diagram contains information on
The following diagram contains information on
A monopoly producer of canned
A monopoly producer of canned
Unlock this Answer For Free Now!
View this answer and more for free by performing one of the following actions

Scan the QR code to install the App and get 2 free unlocks

Unlock quizzes for free by uploading documents