Figure 6-B 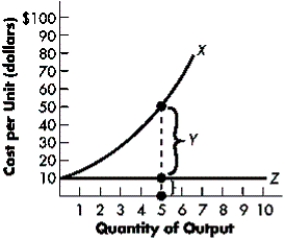
-Refer to Figure 6-B.The distance Y between the two curves in the diagram is:
A) the total cost of producing five units of output.
B) the total variable cost of producing five units of output.
C) the total fixed cost of producing five units of output.
D) the average variable cost of producing five units of output.
E) the average fixed cost of producing five units of output.
Correct Answer:
Verified
Q151: Figure 6-D Q152: Figure 6-A Q153: Figure 6-A Q154: Figure 6-A Q155: Figure 6-C Q157: Table 6-E Q158: Figure 6-D Q159: Figure 6-C Q160: Table 6-D Q161: Figure 6-F Unlock this Answer For Free Now! View this answer and more for free by performing one of the following actions Scan the QR code to install the App and get 2 free unlocks Unlock quizzes for free by uploading documents![]()
![]()
![]()
![]()
![]()
![]()
![]()
The table below shows how![]()

