Exhibit 4-C 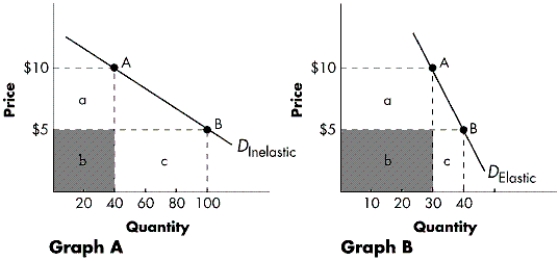
-Refer to Exhibit 4-C.Graph A represents a demand curve that is relatively ____.Total revenue ____ as the price decreases from $10 to $5.
A) inelastic; decreases
B) elastic; decreases
C) elastic; increases
D) inelastic; increases
Correct Answer:
Verified
Q33: Total welfare gains from trade to the
Q158: Fred's demand schedule for movie DVDs is
Q159: Based on the table below, what
Q160: Fred's demand schedule for movie DVDs is
Q161: Based on the graph below, what is
Q162: Exhibit 4-C Q164: Figure 4-A Q166: The area between the market price and Q167: Exhibit 4-B Q168: Exhibit 4-A Unlock this Answer For Free Now! View this answer and more for free by performing one of the following actions Scan the QR code to install the App and get 2 free unlocks Unlock quizzes for free by uploading documents![]()
The diagram below represents the market![]()
![]()

