Figure 4-B 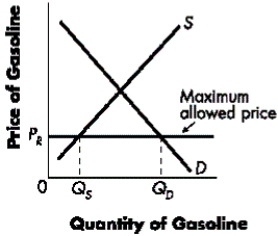
-Refer to Figure 4-B.The graph portrays the market for gasoline for which a ____ has been imposed, and, as a result, a ____ of gasoline occurs.
A) price floor; surplus
B) price ceiling; shortage
C) price ceiling; surplus
D) price floor; shortage
Correct Answer:
Verified
Q189: Table 4-D
Miles demands jazz CDs according
Q190: Table 4-B Q191: Table 4-E Q192: Table 4-D Q193: Table 4-A Q195: Table 4-F Q196: Table 4-F Unlock this Answer For Free Now! View this answer and more for free by performing one of the following actions Scan the QR code to install the App and get 2 free unlocks Unlock quizzes for free by uploading documents
The schedule below shows the
Miles demands jazz CDs according
Use the following information about
The schedule below represents the
The schedule below represents the

