Multiple Choice
Figure 3-G
The diagram below represents the market for butter. 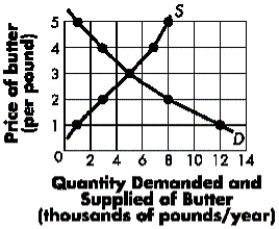
-Refer to Figure 3-G.The equilibrium price of butter is:
A) $5.
B) $3.
C) $2.
D) $1.
E) 50 cents.
Correct Answer:
Verified
Related Questions
Q14: Figure 3-H Q15: Figure 3-H Q16: Table 3-D Q17: Table 3-D Q18: Table 3-D Q20: Table 3-D Unlock this Answer For Free Now! View this answer and more for free by performing one of the following actions Scan the QR code to install the App and get 2 free unlocks Unlock quizzes for free by uploading documents![]()
![]()
Use the following information about
Use the following information about
Use the following information about
Use the following information about

