Figure 3-H 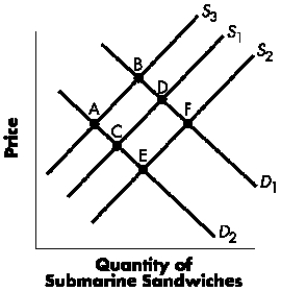
-Refer to Figure 3-H.The movement from ____ is consistent with a decrease in demand.
A) Point B to Point D
B) Point D to Point B
C) Point D to Point C
D) Point C to Point D
E) None of the above are correct.
Correct Answer:
Verified
Q5: Figure 3-G
The diagram below represents the market
Q6: Figure 3-H Q7: Figure 3-G Q8: Figure 3-H Q9: Table 3-D Q11: Table 3-D Q12: Figure 3-H Q13: Figure 3-G Q14: Figure 3-H Q15: Figure 3-H Unlock this Answer For Free Now! View this answer and more for free by performing one of the following actions Scan the QR code to install the App and get 2 free unlocks Unlock quizzes for free by uploading documents![]()
The diagram below represents the market![]()
Use the following information about
Use the following information about![]()
The diagram below represents the market![]()
![]()

